Our 2020 LandVest Index reported an unprecedented explosion in sales of luxury properties across New England and the Adirondacks. The imperatives for refuge and a new sense of life and work balance continue to drive the market into the second quarter of 2021. With low inventory and high demand, buyers need brokers who have their fingers on the pulse of the market and the connections to get ahead of the pack. Sellers are reaping the benefits but must price smartly. Buyers understand that competitive bidding is likely but won’t engage if they feel the premium is too high. At LandVest we have more than 50 years of experience specializing in the luxury market. We’ve seen it all and can help you navigate the complexities of this novel COVID environment.
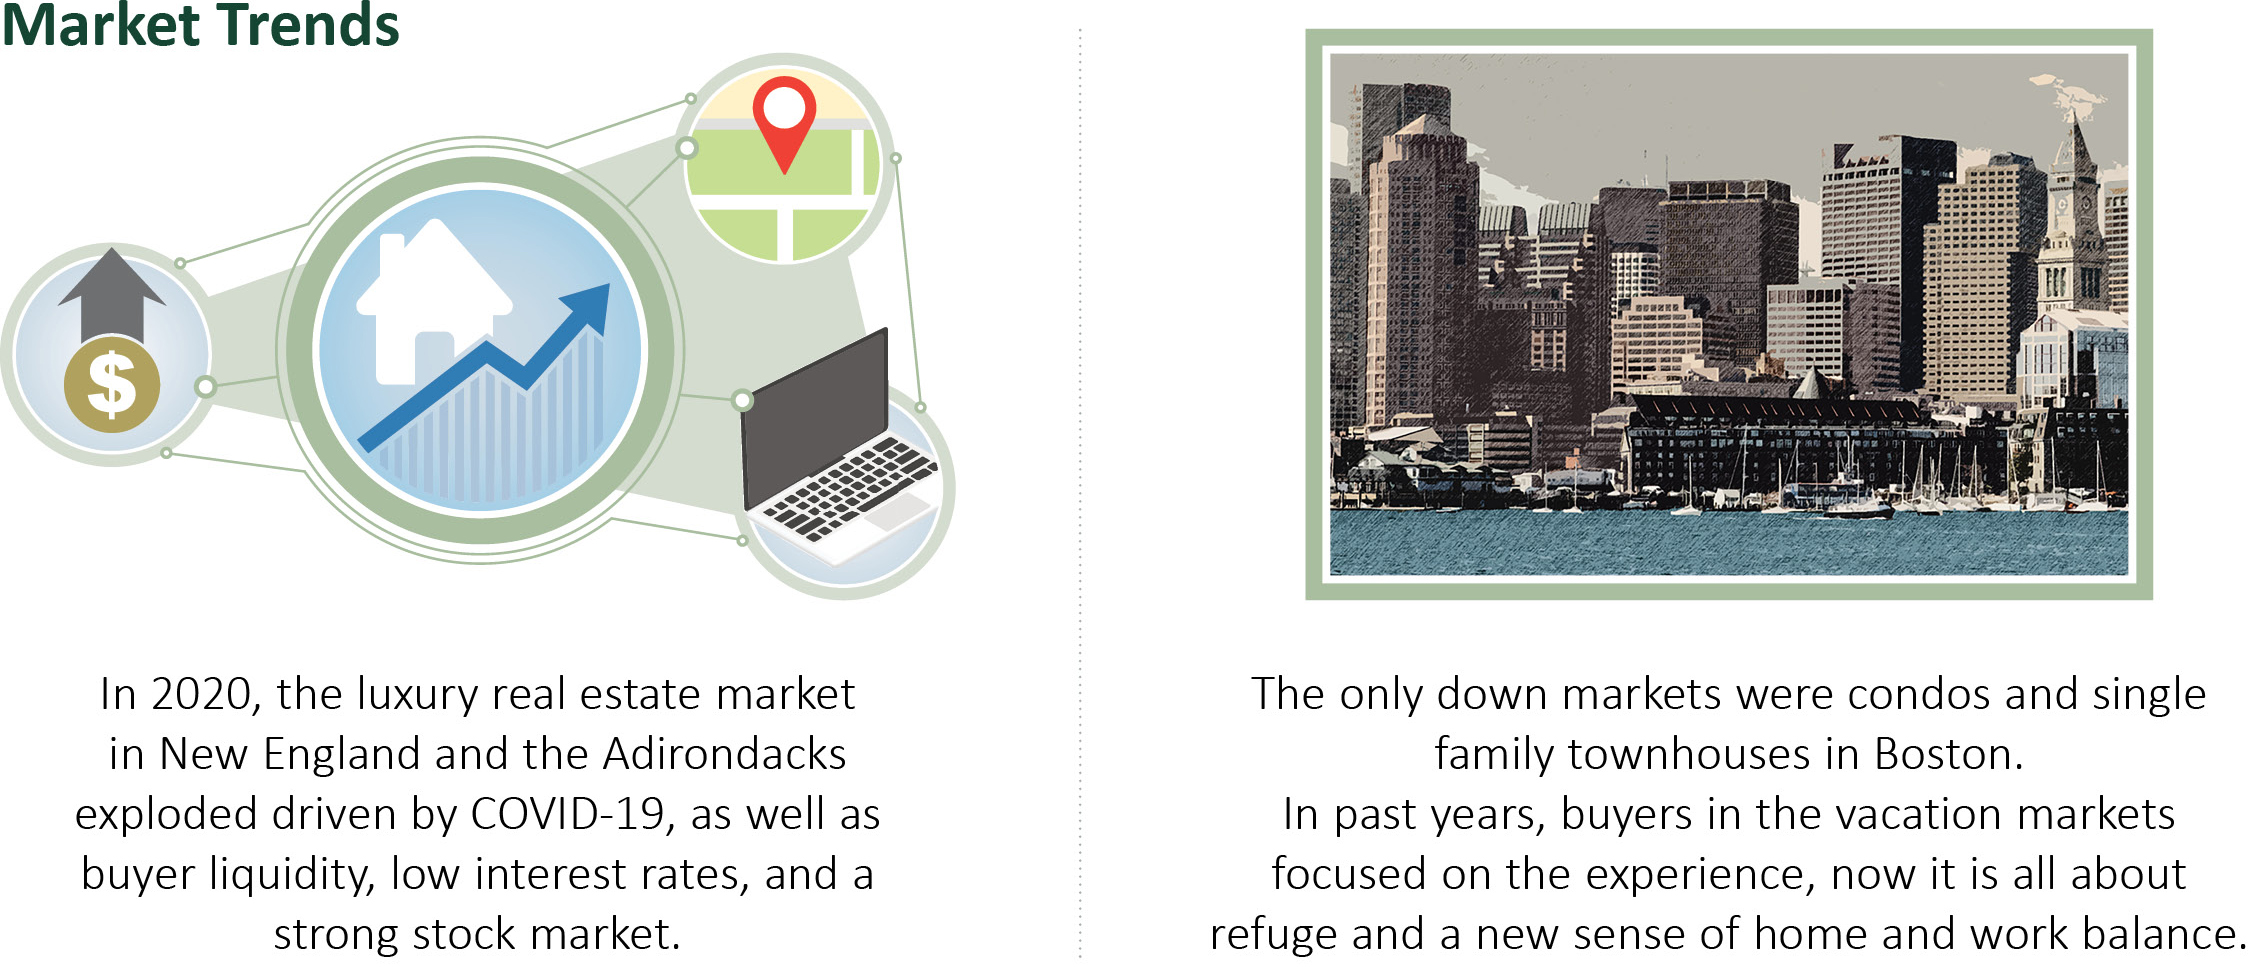
Market Trends
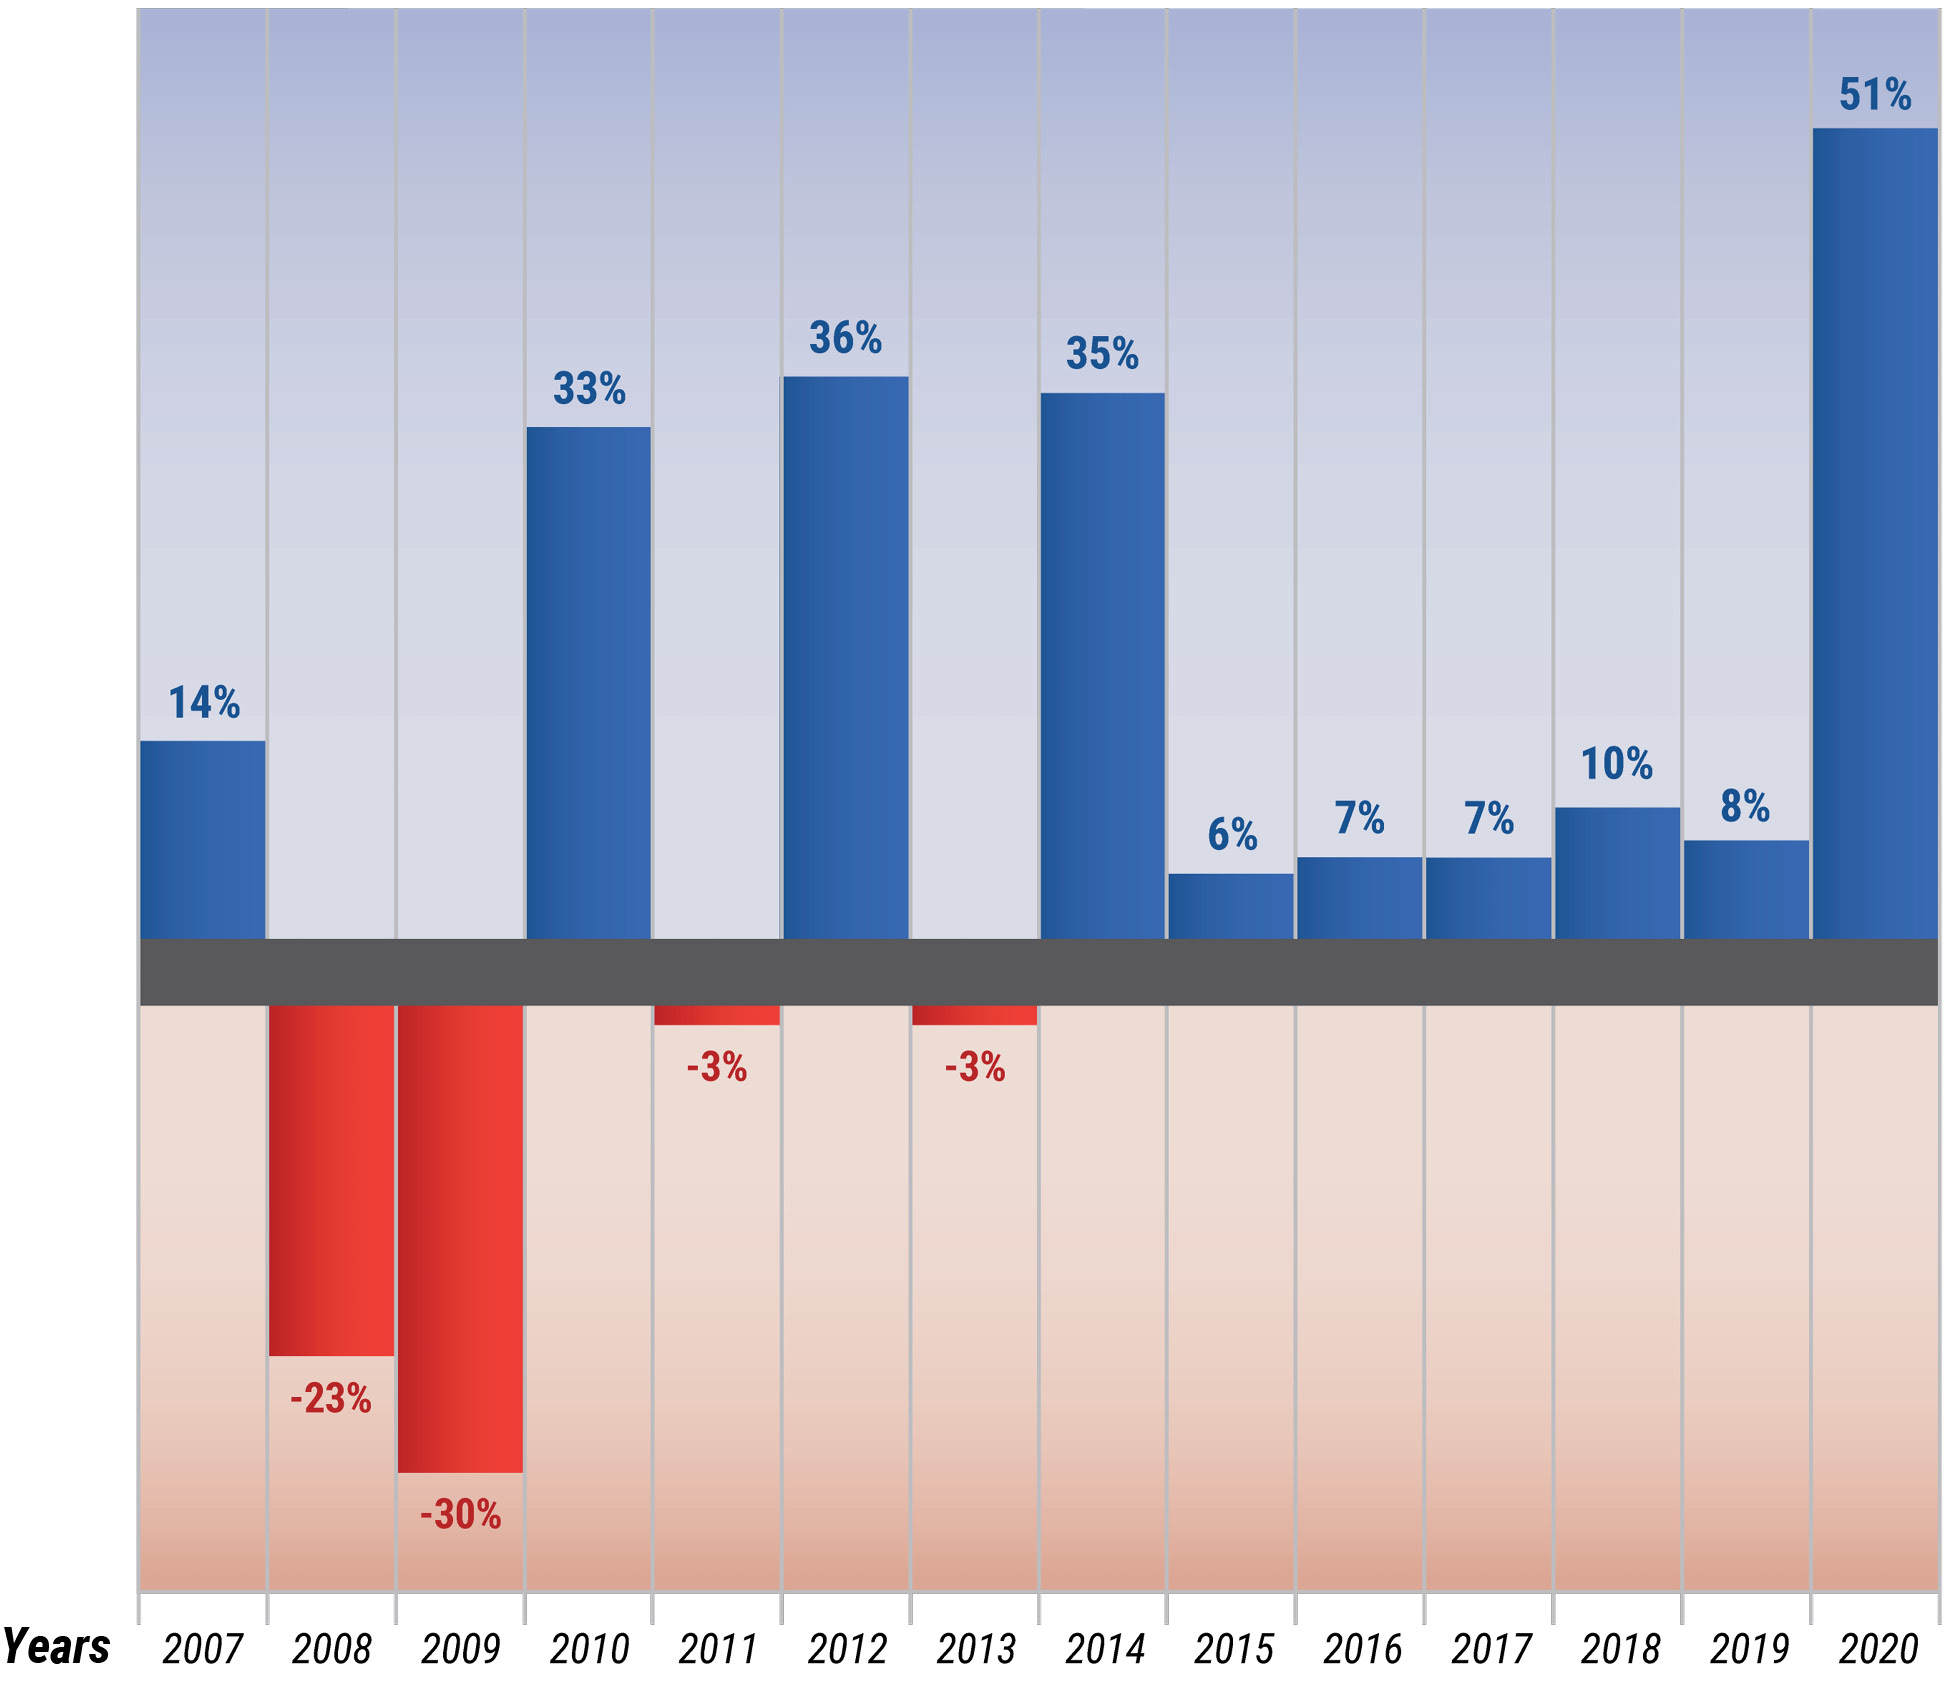
High-End Sales Volume
% Change, Year-to-Year
Sales volumes increased by 51% compared to 2019 (2,592 vs 1,713 sales). Compared to 2006 (838 sales), our baseline year, sales are up 209%, and have recovered substantially from a bottom of 513 sales in 2009. High-end markets are experiencing bidding wars resulting in premiums for sellers, but at the highest end of the market, buyers are selective and value-conscious.
New England & The Adirondacks Market
 |
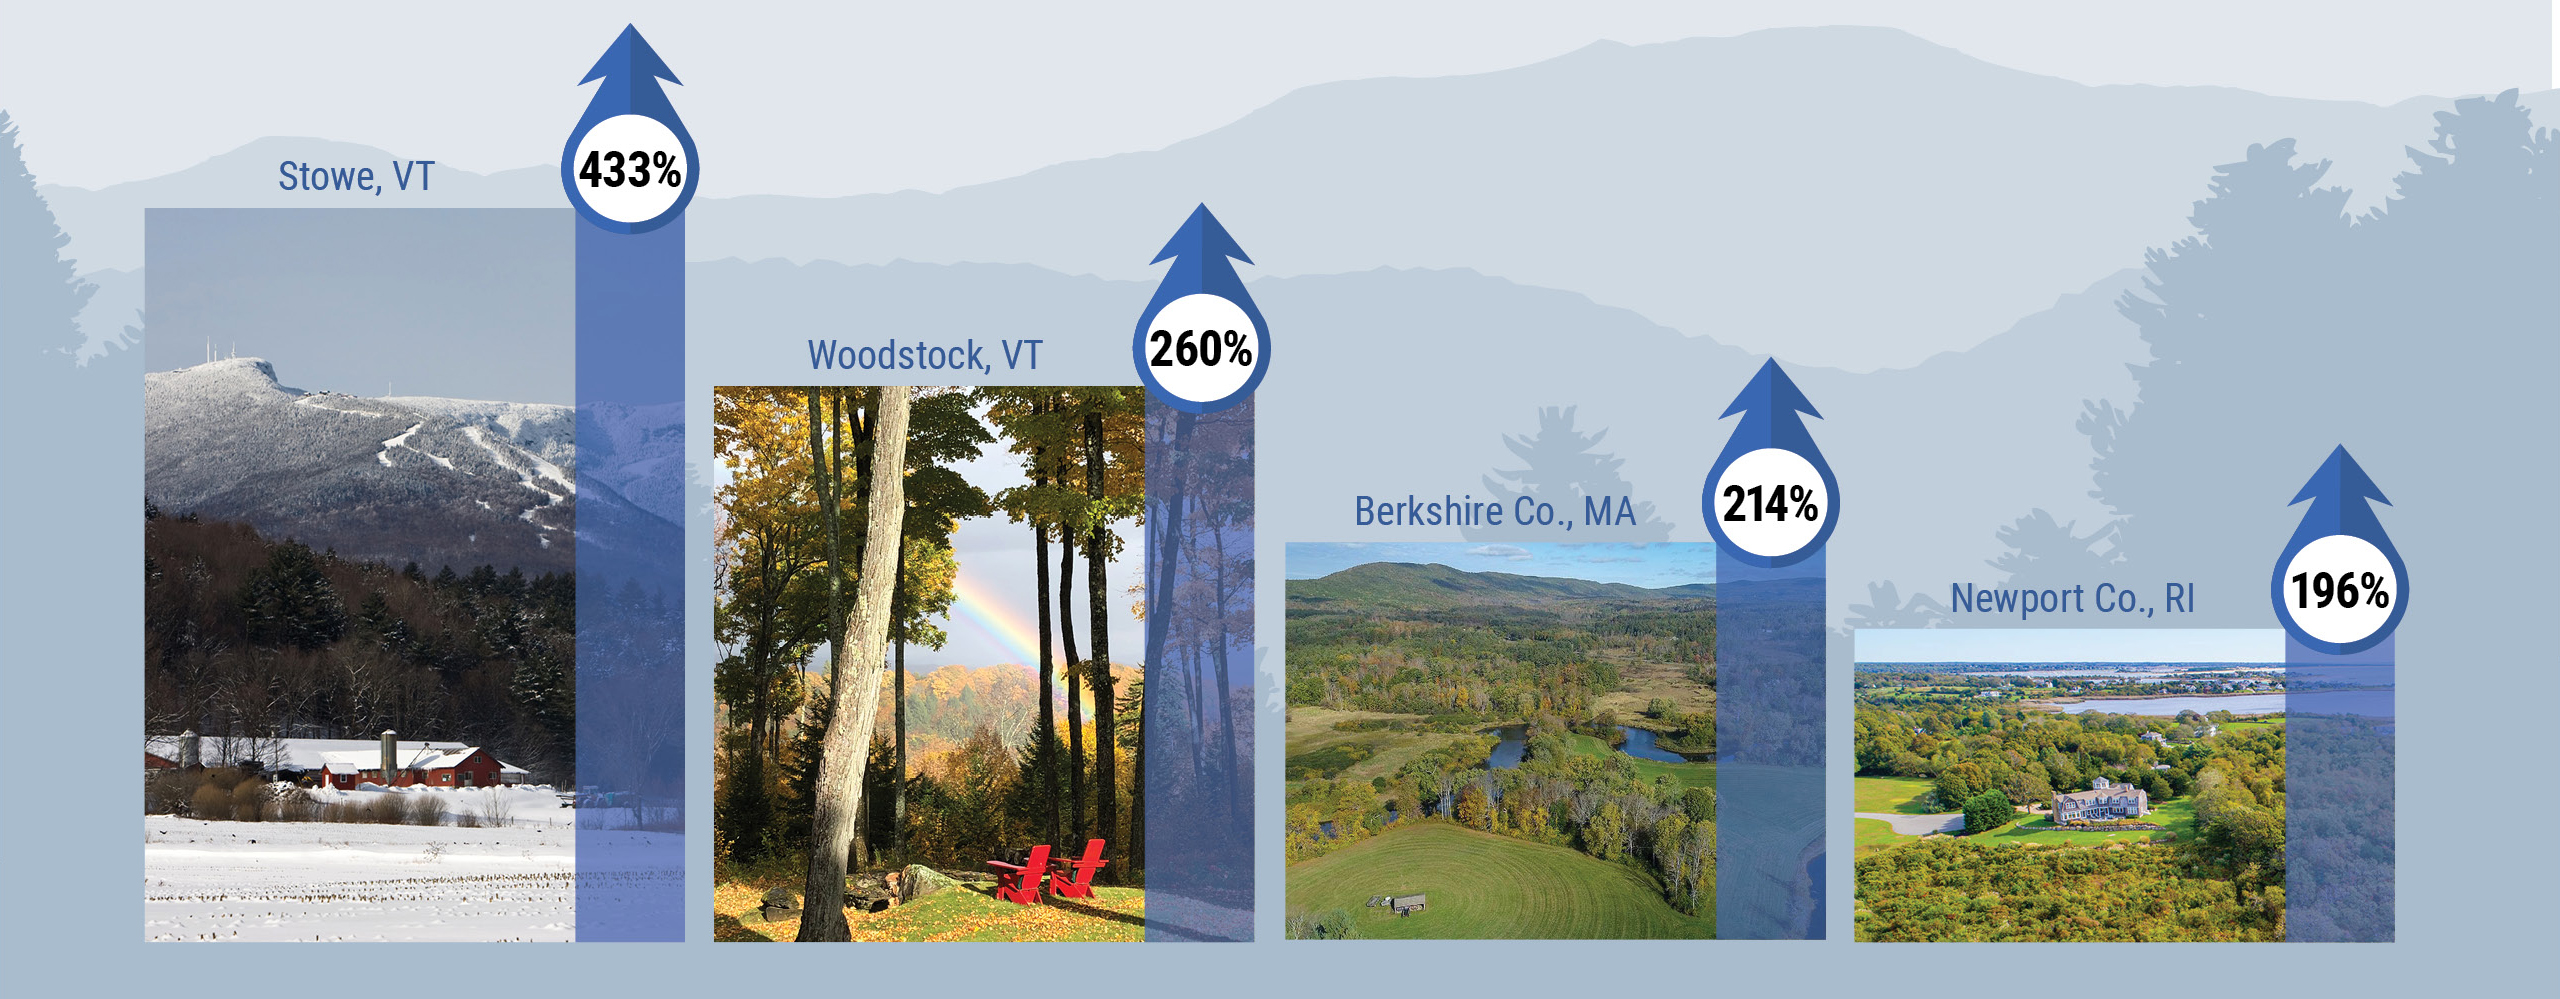
Stewart Young, LandVest’s Regional Director on Cape Cod and in Boston’s western suburbs, compiles the LandVest Index. According to Young: “In 2020, most markets started the year off slowly as listings were delayed or temporarily withdrawn, but by mid-year, there was a sea change in market activity. By year-end, many markets struggled due to a lack of inventory. The largest % increases in sales were in Stowe VT 433%, Woodstock VT 260%, Berkshire County MA 214%, and Newport County RI 196%, likely driven by the influence of New York and Connecticut based buyers. |
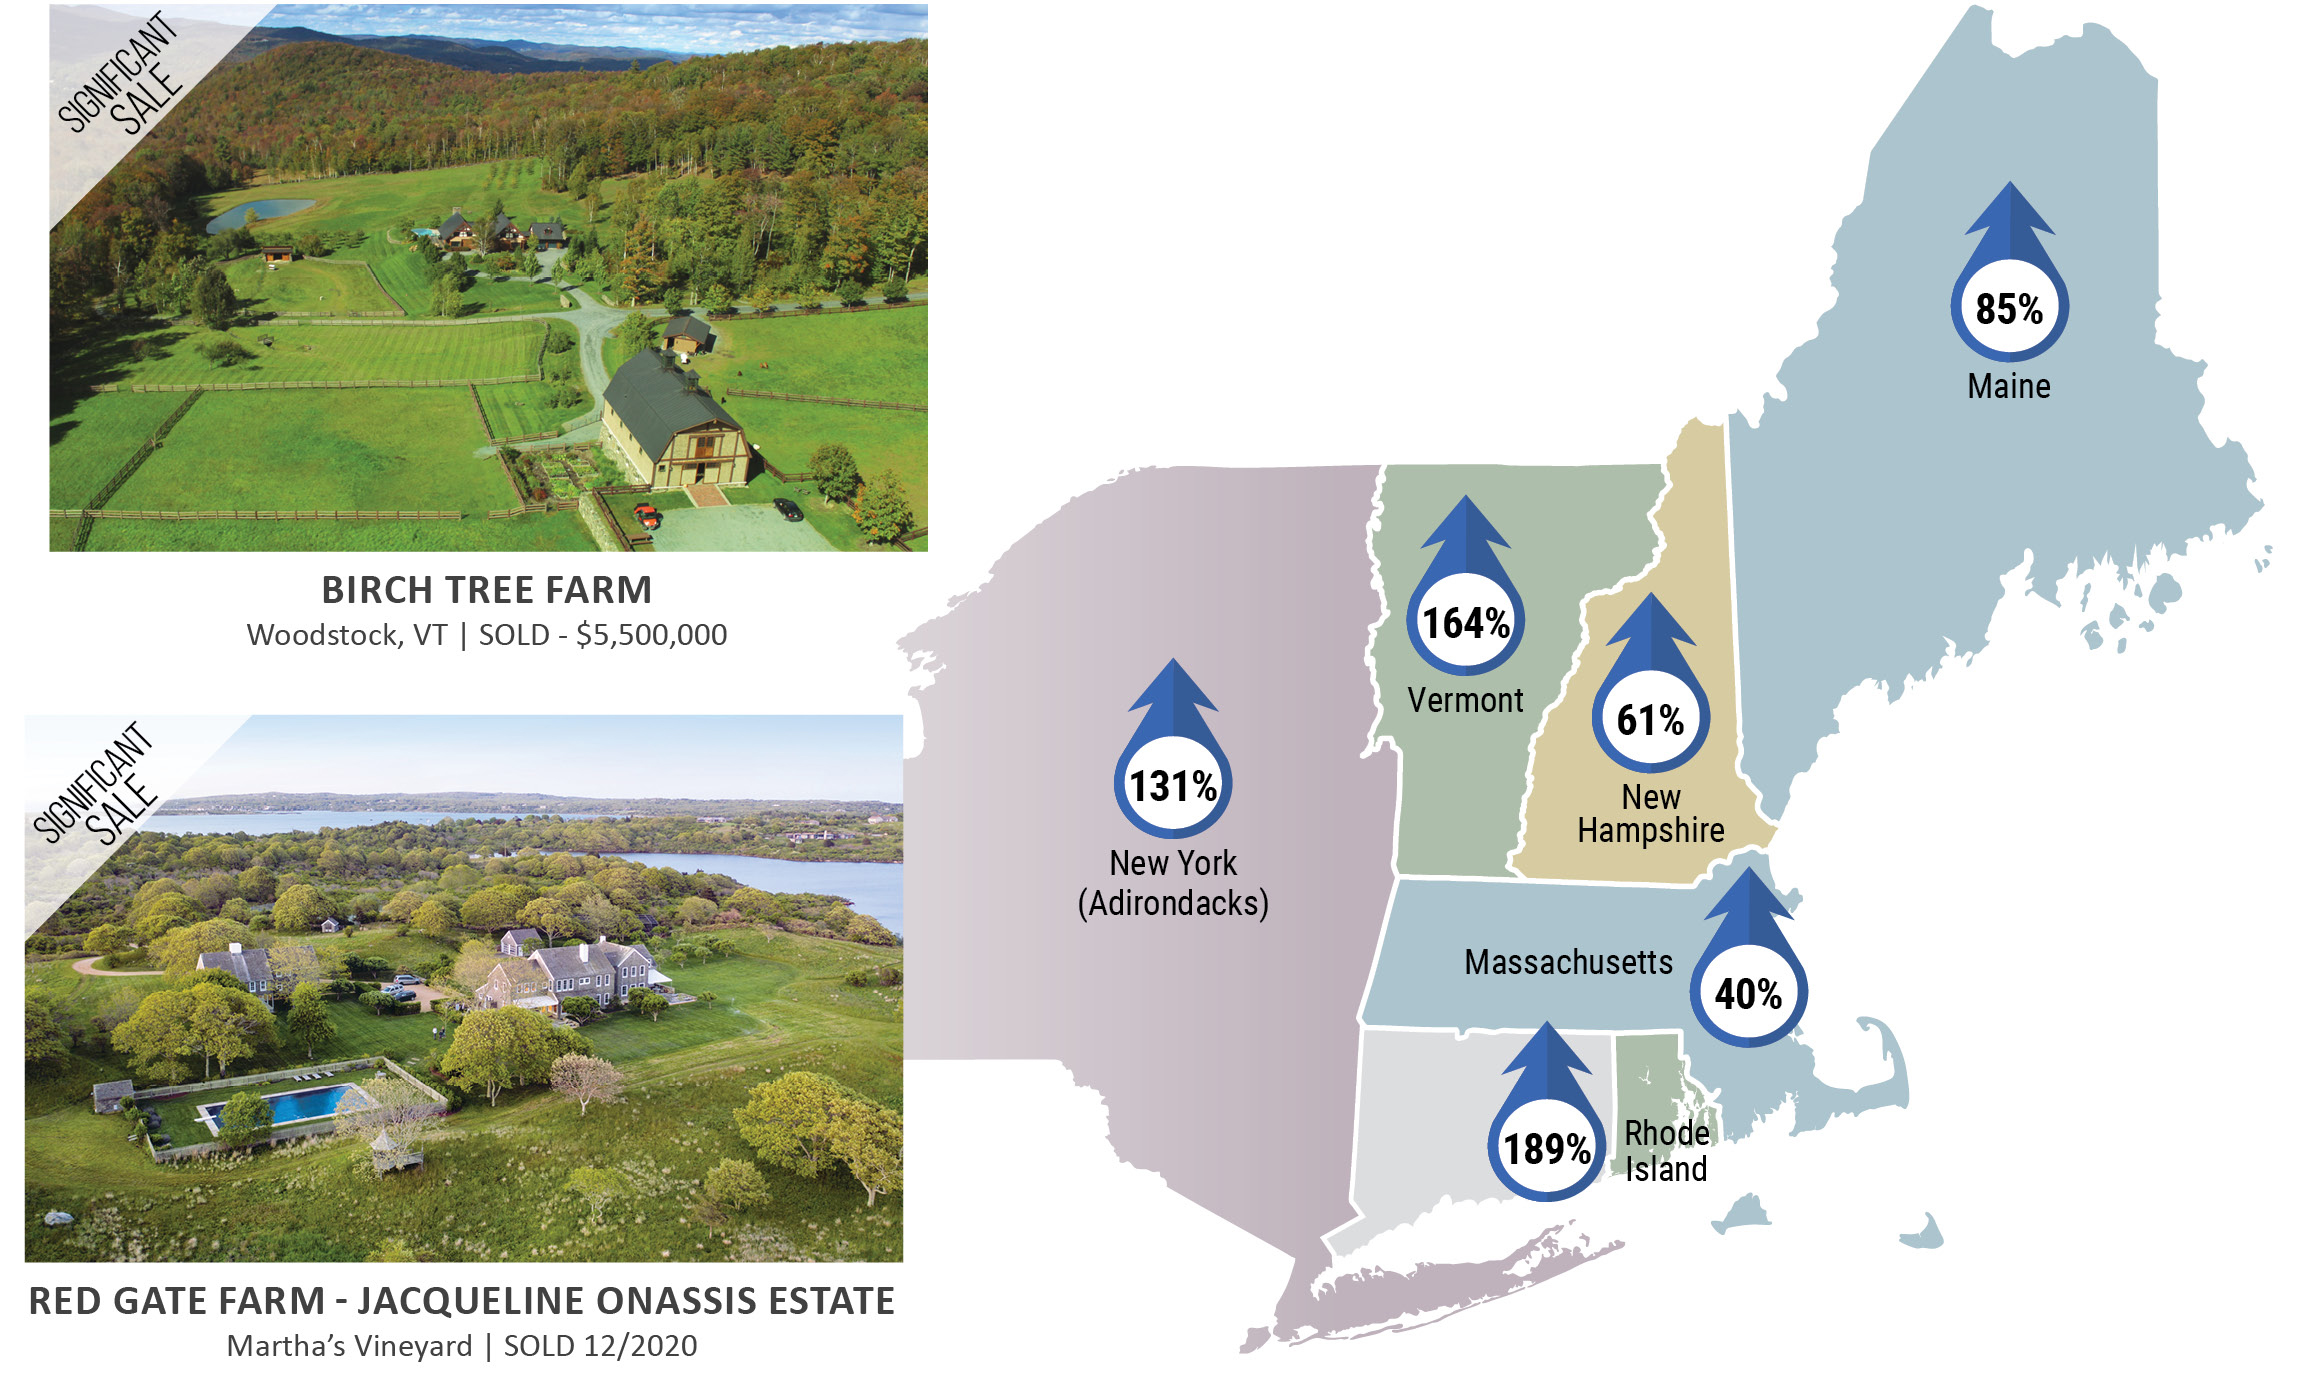
Other vacation markets with large % increases in sales include: in ME, Hancock county (e.g., Mt. Desert Island) 125% and Midcoast (e.g., Camden) 114%; in MA, Cape Cod 92%, Martha’s Vineyard 76%, and Nantucket 126%; in NH, Seacoast 118%; in NY, Adirondacks and Columbia county 131%; in RI, Washington county 181%; and in VT, Southern VT 185%.
Massachusetts Market
In Massachusetts, all of the markets followed were up with the exception of Suffolk county. Berkshire county led the pack with a 214% improvement in sales followed by Nantucket up 126% and Worcester county up 122%. Franklin, Hampshire, and Hampden presented no significant change.
Market Perspectives
 |
Ruth Kennedy Sudduth, LandVest’s Vice Chair observed: “The COVID environment focused attention on what is important: home, space, connection with each other and with nature. While the pandemic’s challenges were unevenly imposed, they prompted a reassessment of life choices for many people. Living somewhere that felt right became incredibly important, driving massive demand for luxury real estate. With supply constrained by COVID logistics, the markets gapped upward. The underlying demographics help as well: Gen-X and Millennials now constitute huge and wealthy buying populations that embrace co-primary homes, remote work and prioritizing a work-life balance, so we expect these themes to dominate the real estate market going forward.” |

- TAYLOR FARMPeacham, VT | $4,995,000
- 7 PINE SUMMITWeston, MA | $4.200,000
- COPPER BEECH HILLWenham, MA | $4,995,000


