Market Highlights
HIGH-END $2,000,000+ MARKET HIGHLIGHTS
- Inventory up 9% (252 vs 231 last year).
- Sales volume up 7% (record 89 vs record 83 last year).
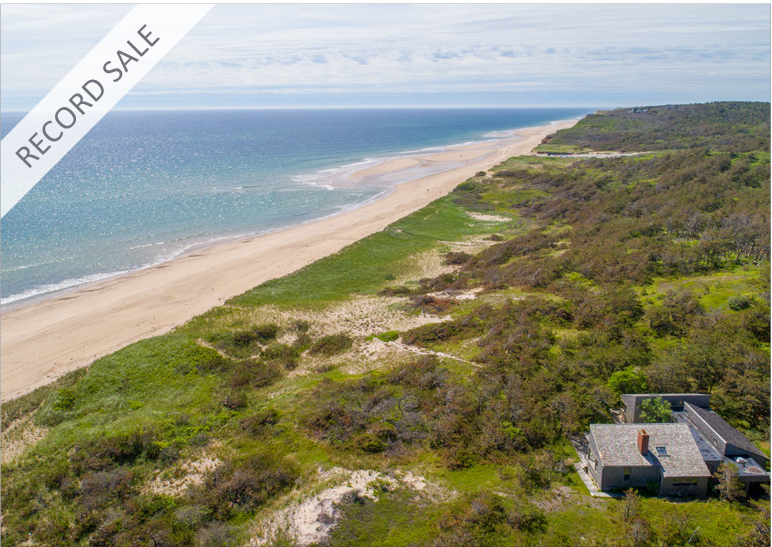
- Top sale: Crocker’s Path, East Dennis, $11,000,000. LandVest Record Sale.
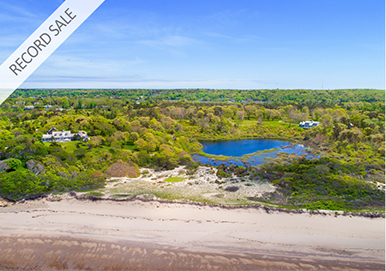
- LandVest’s markets continue to perform strongly with significant record sales.
- For the first three quarters of 2019, expanding inventory, strong stock market, and increased demand suggest a balanced market, but buyers at the high-end continue to be value-conscious and have little tolerance for compromise. As usual special properties, expertly presented, reaching out to a broad market with a strong value proposition, will be well received by the market.

Active Listings
At the end of the third quarter, the high-end inventory was increased 9% to 252 listings compared to 231 last year and the record of 283 listings in 2015. Historically speaking, the inventory is on par with the ten-year average of 249 listings.

High-End Sales
Record performance in the first three quarters with 89 sales, up 7% from last year’s record of 83 sales and the ten-year average of 62 sales. The Cape high-end market has been strong since 2012, breaking the annual 100 sales barrier for the first time in 2018, up 12% to 111 sales from the previous record of 98 sales in 2016. This record performance in the first three quarters and the strong stock market bode well for another record year for high-end real estate on Cape Cod. On the other hand, the spectre of recession looms large. How and whether it will impact the Cape market remains to be seen.

Q1-Q3 2019 Top Sale
Property: Crocker’s Path • Town: East Dennis • Selling price: $11,000,000
LandVest Record Sale: 20-acre waterfront compound with 2 dwellings, barn with apartment, and 2 building lots.

Highest & Median Sale

Days on Market
Days on market for high-end sales in the first three quarters increased 15% to 365 from 317 last year, but below the ten-year average of 393. The high mark of 559 days on market was set in 2011, while the low mark was 99 days in 2000. The range of days on market for these sales in the first three quarters is remarkably wide from 9 days to more than 10 years.

Sales by Town
In the first three quarters, 14 of the 15 towns on Cape Cod had sales at or above the $2,000,000+ level. Barnstable is the leader with 18 sales and a ten-year average of 16 sales. Within Barnstable, Osterville accounted for 10 of these 18 sales. Chatham followed with 16 sales and a ten-year average of 13 sales and Falmouth had 13 sales, matching its record last year, and a ten-year average of 8 sales. Mashpee and Orleans have smaller sales volumes but are performing at record levels with 7 sales each.


For additional information about LandVest’s brokerage, real estate consulting, and appraisal services, please contact:
Stewart Young | syoung@landvest.com | 617-359-8930 or
Jamie Crowley | jcrowley@landvest.com | 508-982-4029
Click here to to see available Cape Cod Real Estate listings.

