Market Highlights
HIGH-END $2,000,000+ MARKET HIGHLIGHTS
- Inventory up slightly, but tight (187 vs 197 ten-year average).
- Sales volume up 17% (record 111 vs 95 last year, 80 ten-year average).
- Top sale: $14,750,000. 97 Tilipi Run, Chatham.
- LandVest’s markets continue to perform strongly with significant record sales.
- For 2019, historically tight inventory and increased demand suggests a seller’s market, but buyers at the high end continue to be value conscious and have little tolerance for compromise. As usual, special properties, expertly presented, reaching out to a broad market with a strong value proposition, are well received by the market.

Active Listings
At year end 2018, the high-end inventory increased slightly to 187 listings compared to 182 last year and the record of 232 listings in 2015.
Historically, the current inventory is tight with a 10-year average of 197 listings at year end.

High-End Sales
Record performance with 111 sales at year end, up 17% from last year’s 95 sales. While the 10-year average at year end is 80 sales, the Cape high-end market has been strong since 2012, breaking the 100 sales barrier for the first time this year and up 12% from the previous record of 99 sales in 2016. Chatham scored the top two sales in 2018 with two additional $10,000,000+ sales in Osterville and Woods Hole. In the $5-10 mil range, there were an additional 11 sales.

Year End 2018 – Top Sale
Property: 97 Tilipi Run • Town: Chatham • Selling price: $14,750,000

Morris Island, 2-acre 11,000-sq-ft beachfront gated estate, built in 2010 with 6 bedrooms, pool pavilion, theater, wine cellar,and guest house. Originally listed for $25,000,000 in 2013.
Highest & Median Sale

Days on Market
Days on market for high-end sales at year end 2018 decreased significantly to 324 from 431 last year and are below the 10-year average of 372. This performance is comparable to that seen during the market recovery in 2012-2013.

Sales by Town
At year end 2018, 14 of the 15 towns on Cape Cod had sales at the $2,000,000+ level. Barnstable and Chatham are the leaders, with 26 and 25 sales respectively. Barnstable has a 10-year average of 20 sales while Chatham has 19. Within Barnstable, Osterville accounted for 18 of the 25 sales. Falmouth followed with 16 sales and a 10-year average of 10. All of the other towns are in single digits.


-

- Shore Road Waterfront Chatham, MA$9,995,000
-
- Prime Cape Cod Waterfront Land Barnstable, Marstons Mills, MA $1,995,000
-

- East Dennis Waterfront Compound East Dennis, MA $19,500,000
-
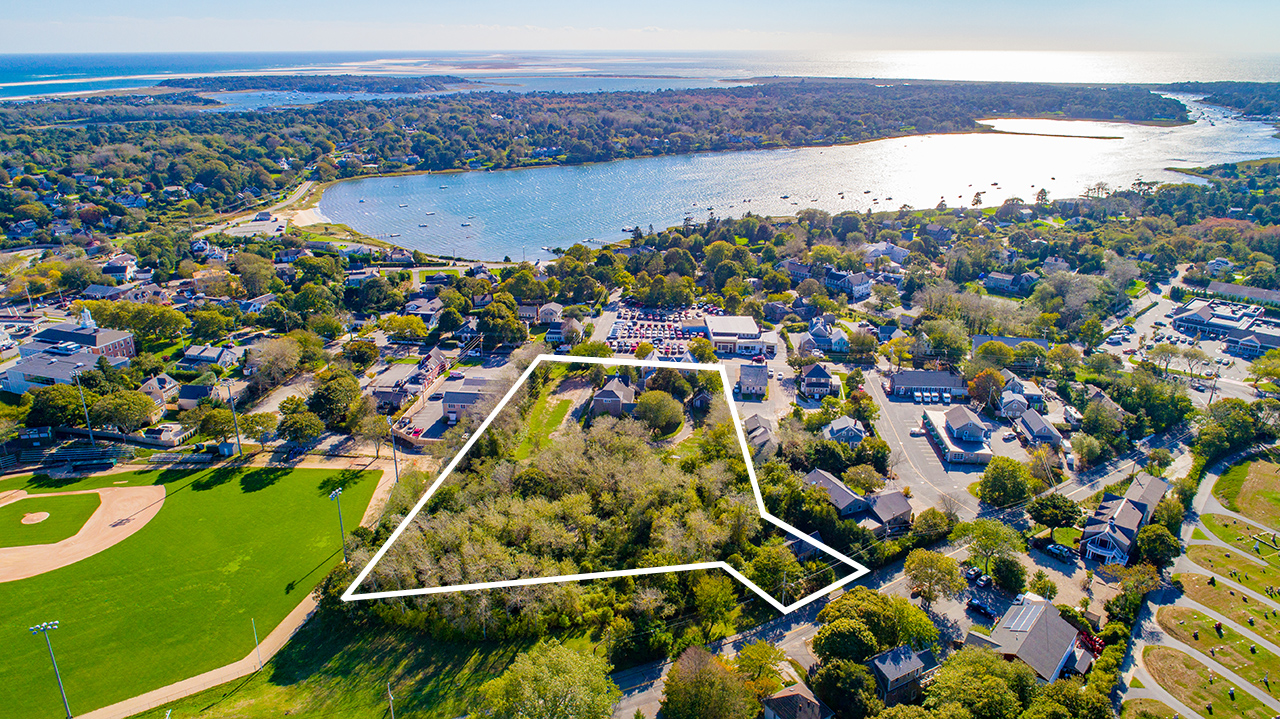
- Main Street Development OpportunityChatham, MA $3,950,000

-

- Atlantic Beachfront GetawayTruro, MA $2,395,000 – Town Record Sale
-

- Wianno Waterfront EstateOsterville, MA $5,200,000
-

- The William W. Graham EstateWest Tisbury, Martha’s Vineyard, MA $32,500,000 – State Record Sale
For additional information about LandVest’s brokerage, real estate consulting, and appraisal services, please contact:
Stewart Young | syoung@landvest.com | 617-359-8930 or
Jamie Crowley | jcrowley@landvest.com | 508-982-4029
Click here to to see available Cape Cod Real Estate listings.

