![]()
Market Highlights
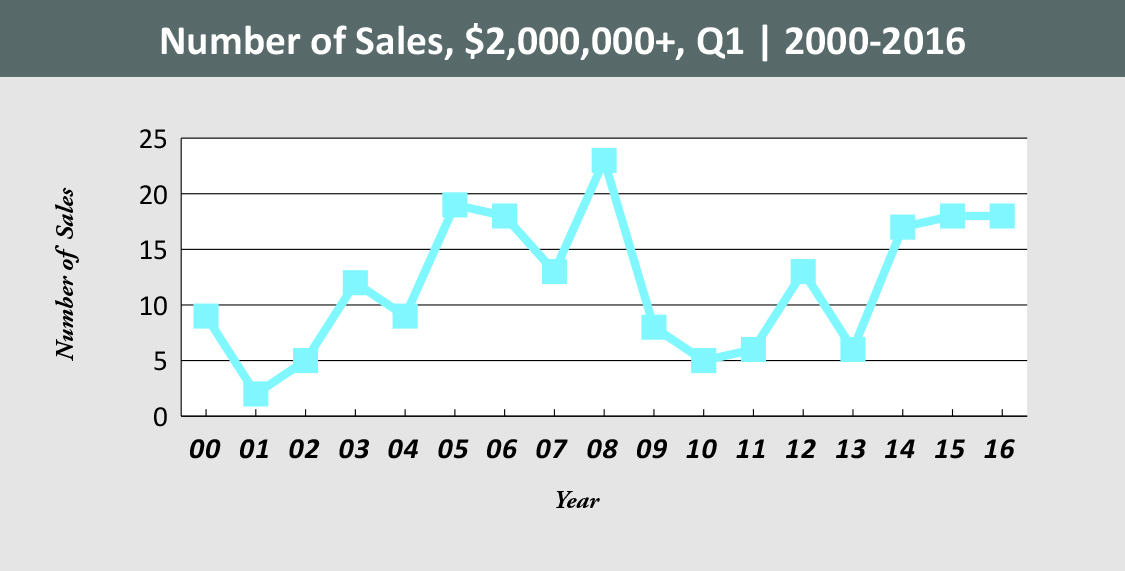
- Sales in the first quarter of 2016 were strong with 18 sales, close to the record of 23 sales in 2008.
- Inventories are at record high levels, especially at the higher end of the price range.
- Pent-up demand and a strong stock market are fueling the market, but excess inventory means sellers must compete for buyers.
- Turnkey properties are favored.
Active Listings & Sales, $2,000,000+ | Q1, 2000-2016
On Cape Cod, Massachusetts, the first quarter inventory of high-end listings is at record levels with 253 listings compared to a recent low of 172 in 2009 and a previous all time high of 246 in the first quarter of 2014. At the end of last year, there were 232 listings vs 188 at the end of 2014. The high-end market on Cape Cod is predominately in the $2-$3 million range. Of the 253 listings, 138 are in the $2-$3 million range, 72 are in the $3-$5 million range, 31 in the $5-10 million range, and 12 at or above $10 million.
High-end sales repeated the record performance of last year with 18 sales of which 12 were in the $2-$3 million range, 4 were in the $3-$5 million range, and 2 in the $5-10 million range ($7.8mm in Osterville and $8.5mm in Chatham). There were no sales above $10 million.

Available Listings


| Seven Winds Woods Hole, MA $13,900,000 |
Seapuit Waterfront Osterville, MA $5,900,000 |
Chapoquoit Island Waterfront West Falmouth, MA $4,275,000 |
Highest and Average Sale, $2,000,000+, Q1, 2000-2016
According to MLS, the top sale in the first quarter was 560 Fox Hill Road in Chatham selling for $8,500,000. This waterfront property consists of 1.8 acres on Crow’s Pond near Eastward Ho Golf Club and with access to Pleasant Bay. The house was built in 2012 and consists of 10,191 sq ft with a pool, spa, and deepwater dock. It was listed for $10,000,000 and was on the market for 175 days.
The median value for high-end sales in the first quarter 2016 was $2,575,000, about on par with median sale prices over the past decade.
Days on Market, Sales, $2,000,000, Q1, 2000-2016
Days on market for high-end properties sold during the first quarter 2016 were up significantly to 679 days compared to 406 days in 2015 and 374 days in 2014. The range is remarkably wide with sales occurring over a range of 1 to 3,719 days.


Sales by Town, $2,000,000, Q1, 2000-2016
Starting around 2002 the high-end market on Cape Cod broadened as the perennial top markets were perceived as being too expensive and as buyers bid up the prices of special properties in other towns. While the volume of sales in the first quarter 2016 is small, the geographic spread is broad with sales in Barnstable (7), (6 different villages), Bourne (1), Chatham (5), Falmouth (2), Mashpee (1), Truro (1), and Yarmouth (1).

The LandVest High-End Market Watch is a periodic review of select high-end markets in Maine, Massachusetts, New Hampshire, Vermont and the Adirondacks. Market data are collected from Multiple Listing Services and do not include private listings. LandVest makes no representation as to the accuracy of the data and therefore is not responsible for any actions taken as a result of use of or reliance on this information.
For additional information about LandVest’s brokerage, real estate consulting, and appraisal services, please contact:
Stewart Young | (syoung@landvest.com) | 617-359-8930
or click here to view
Stewart’s current Real Estate listings.
