Market Highlights
HIGH-END $2,000,000+ MARKETS HIGHLIGHTS
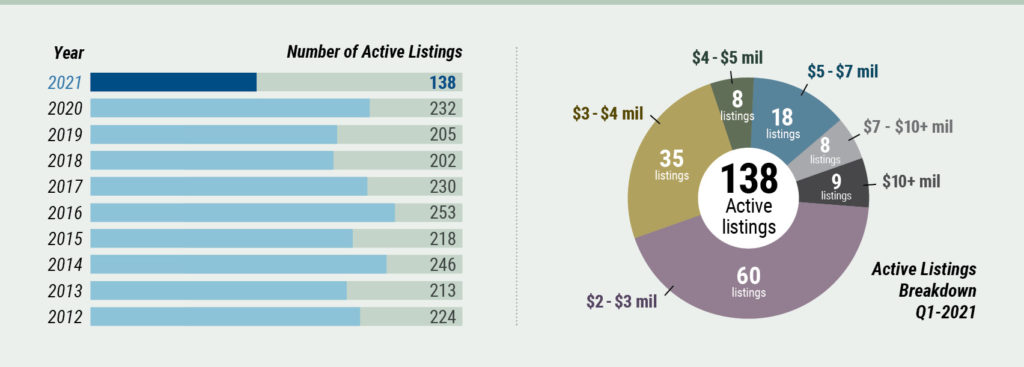
- Inventory down 41% (138 vs 232 last year).
- Sales volume up 247% (record 59 vs 17 last year).
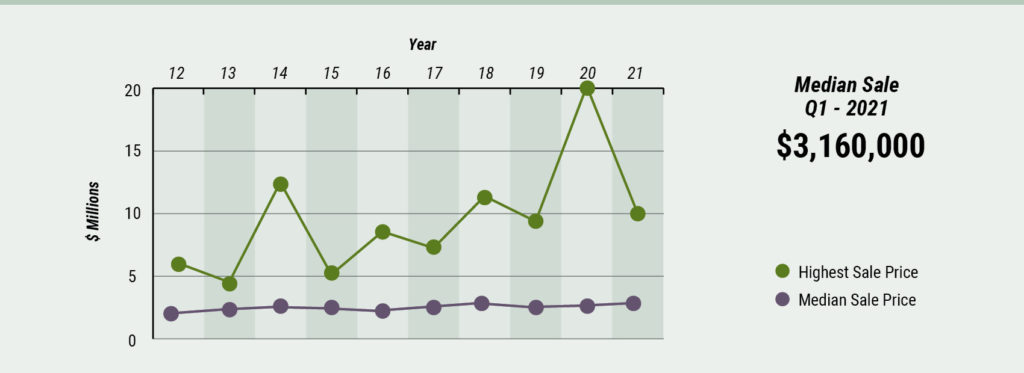
- Top sale: $9,850,000 – 230 Cedar Street, Chatham.
- Cape Cod’s high-end market continues to perform strongly despite decreasing inventories since Q2 2020.
- COVID-driven demand for refuge and home-work balance remains a factor in the market. As usual, special properties, expertly presented, reaching out to a broad market with a strong value proposition, will have a competitive advantage

Active Listings
At the end of the first quarter, the high-end inventory decreased by 41% to 138 listings compared to 232 last year and the record of 253 listings in 2016. Historically speaking, the inventory is significantly lower than the ten-year average of 216 listings. Inventories began decreasing in the second quarter of 2020 and continued to decrease through the year paralleled by an explosive growth in sales.
High-End Sales
Sales volume was up 247% with 59 sales compared to 17 sales in Q1 2020 and the ten-year average of 20 sales. The Cape high-end market has been strong since 2012, breaking the annual 100 sales barrier for the first time in 2018 and finishing last year with 226 high-end sales. If the COVID-driven demand for refuge properties and a work-from-home lifestyle continues as signaled by a backlog of 49 properties under agreement, 2021 promises to be another record-breaking year.

Q1 2021 – Top Sale
Property: 230 Cedar Street •Town: Chatham •Selling price: $9,850,000
Family compound on 7.8 acres fronting on Oyster Pond with a deep water dock and pool. The residence was built in 1960 and comprises 5,299 sq ft. It spent 445 days on market, originally listed for $10,500,000.
Highest & Median Sale
Days on Market
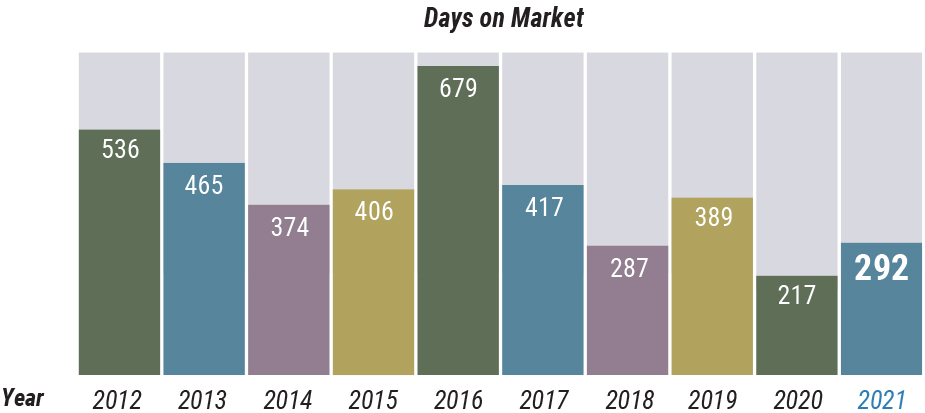
Days on market for high-end sales in the first quarter increased significantly to 292 from 217 last year, a ten-year record low, but remain below the ten-year average of 406. The range in days on market is wide, from 1 to 1609.
Sales by Town
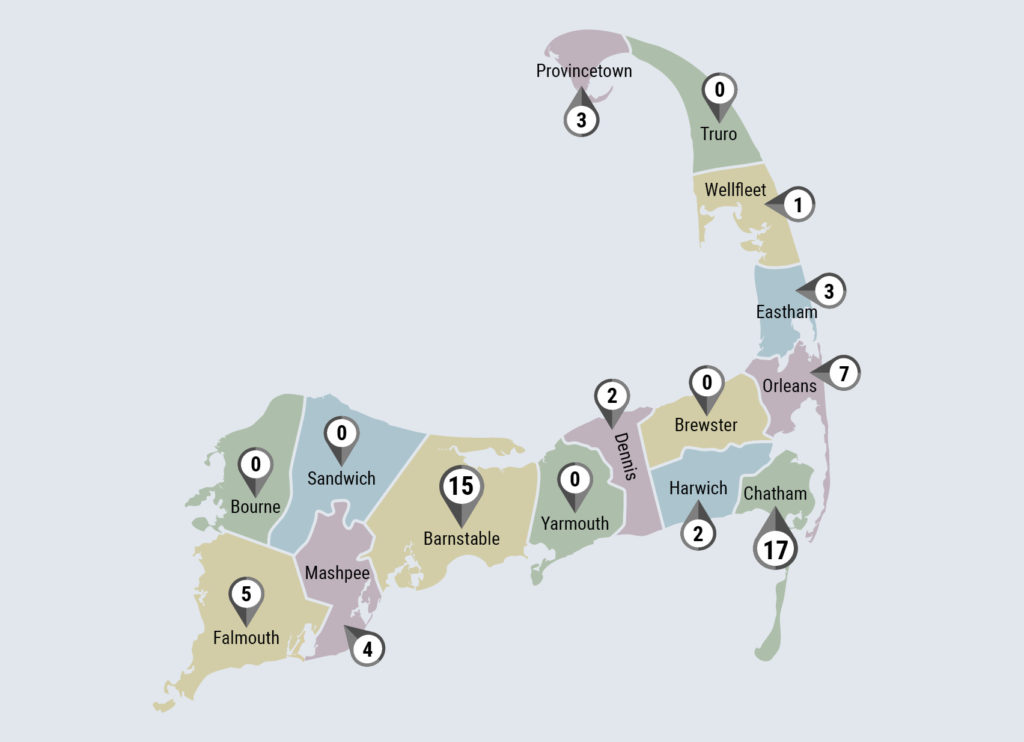
In the first quarter, 10 of the 15 towns on Cape Cod had sales at the $2,000,000+ level. The three leading towns, Chatham, Barnstable (mostly Osterville, 8 of 15 sales), and Orleans together had 39 or 66% of the sales compared to 5 sales last year, and a ten-year average of 11 sales. Orleans is particularly noticeable with 7 sales in Q1 compared to 1 last year. In 2020, Orleans recorded 29 sales vs a ten-year average of 9 sales.


For additional information about LandVest’s brokerage, real estate consulting, and appraisal services, please contact:
Stewart Young | (syoung@landvest.com) | 781-405-3174
or click here to view Stewart’s current Real Estate listings.


